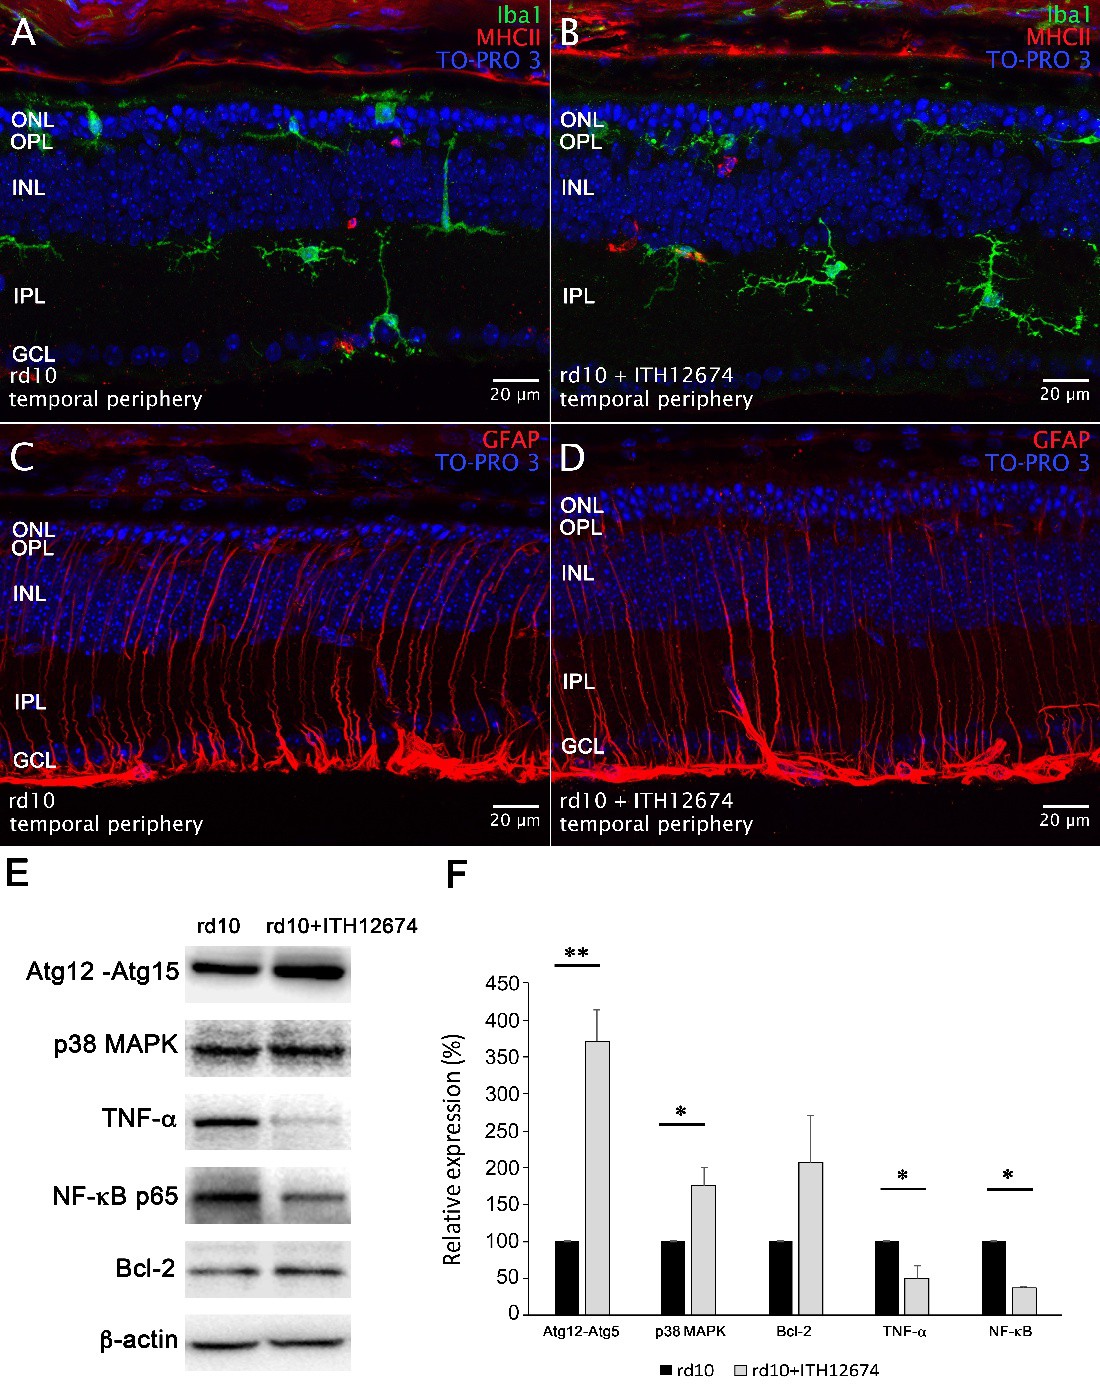
Fig. 7. Effect of ITH12674 on the oxidative stress and inflammatory state of the retina. (A-D) Representative vertical retinal sections of non-treated (A, C) and ITH12674-treated rd10 mice (10 mg/Kg) (B, D) (age P30) labeled for Iba1 (microglial cells, green), MHC class II (activated microglial cells, red) and GFAP (Müller cells, red). Nuclei were stained with TO-PRO 3 (blue). ONL: outer nuclear layer; OPL: outer plexiform layer; INL: inner nuclear layer; IPL: inner plexiform layer; GCL: ganglion cell layer. Scale bar 20μm. (E) Representative images of Western blots showing the relative expression levels of Atg12-Atg5, p38 MAPK, TNF-α, NF-κB, Bcl-2 and β-actin in non-treated rd10 and ITH12674-treated animals. Western blots were performed by triplicates. (F) Bar graph shows the quantification of the expression levels obtained from 3 independent experiments. *P<0.01.